Q1. Find the mode of the following distribution:
Class
0 - 10
10 - 20
20 - 30
30 - 40
40 - 50
Frequency
15
18
16
5
6
Solution
Modal class = 10 - 20
So, l = 10, f1 = 18, f0 = 15, f2 = 16, h = 10
 = 10 +
 = 10 + 6
= 16
= 10 + 6
= 16
= 10 + 6
= 16
Q2. The mean of a data set with 10 observations is calculated as 17.85. If one more value is included in the data, then for the new data with 11 observations, mean becomes 18.50. Value of this 11th observation is
Solution
Let x1, x2, x3 …, x10 be the 10 values of the given data.
Let the 11th observation be x11.
x1 + x2 + x3 + ……..+ x10 = 10  17.85 = 178.5
x1 + x2 + x3 + ……..+ x10 + x11= 11 18.50 = 203.50
(x1 + x2 + x3 +……..+ x10) + x11 = 203.50
x11 = 203.50 - 178.50 = 25
17.85 = 178.5
x1 + x2 + x3 + ……..+ x10 + x11= 11 18.50 = 203.50
(x1 + x2 + x3 +……..+ x10) + x11 = 203.50
x11 = 203.50 - 178.50 = 25
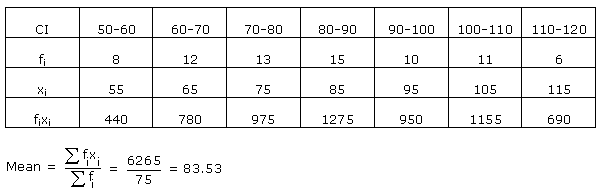
Q3. The mean of the following data is:
45, 35, 20, 15, 25, 40
Solution

Q4. The
mean of the following distribution is 22, find the missing frequency f:
Class
0 -
10
10
- 20
20
- 30
30
- 40
40
- 50
Frequency
12
16
6
f
9
Solution
C.I
f
xi
fi
xi
0
- 10
12
5
60
10
- 20
16
15
240
20
- 30
6
25
150
30
- 40
f
35
35f
40
- 50
9
45
405
43
+ f
855
+ 35f


 946 + 22f = 855 + 35f
91 = 13f
f= 7
946 + 22f = 855 + 35f
91 = 13f
f= 7
Q5. For a symmetrical distribution, which is correct
- 1) Mean = Median = Mode
-
2) Mode =

- 3) Mean > Mode > Median
- 4) Mean < Mode < Median
Solution
In symmetrical distribution, Mean=Mode=Median
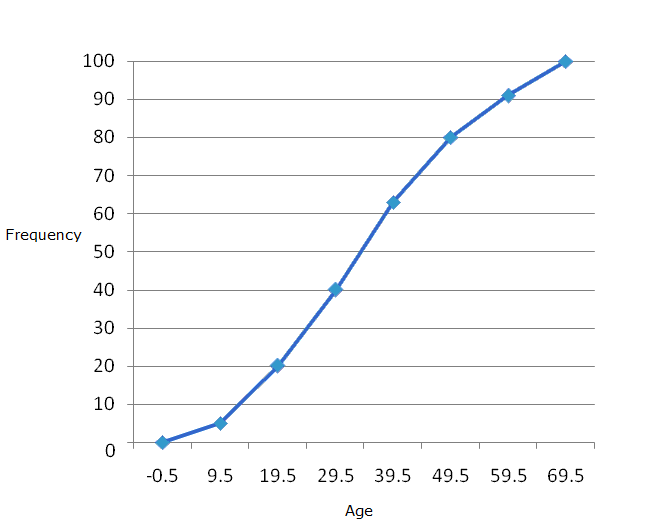
Q6. From the following data, draw the two types of cumulative frequency curves and hence determine the median.
Height (in cm)
Frequency
140 - 144
144 - 148
148 - 152
152 - 156
156 - 160
160 - 164
164 - 168
168 - 172
172 - 176
176 - 180
3
9
24
31
42
64
75
82
86
34
Solution
We prepare less than series and more than series.
(i)Less than series
Height in (cm)
c.f.
Less than 140
Less than 144
Less than 148
Less than 152
Less than 156
Less than 160
Less than 164
Less than 168
Less than 172
Less than 176
Less than 180
0
3
12
36
67
109
173
248
330
416
450
Now on graph paper plot the points (140, 0), (144, 3), (148, 12), (152, 36), (156, 67), (160, 109), (164, 173), (168, 248), (172, 330), (176, 416), (180, 450).
(ii)More than series
Height in cm
c.f.
More than 140
More than 144
More than 148
More than 152
More than 156
More than 160
More than 164
More than 168
More than 172
More than 176
More than 180
450
447
438
414
383
341
277
202
120
34
0
Now on the same graph plot the points (140, 450), (144, 447), (148, 438), (152, 414), (156, 383), (160, 341), (164, 277), (168, 202), (172, 120), (176, 34), (180, 0)
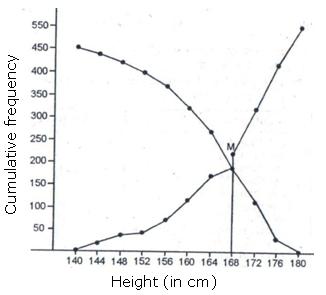 From the graph, it is clear that 168 is the median.
From the graph, it is clear that 168 is the median.
Q7. The median of the observations given in order 16, 18, 20, 24 - x, 22 + 2x, 28, 30, 32 is 24. Find the value of x.
Solution
Total no. of terms = 8
 Median =

Median =
Q8. 
Solution
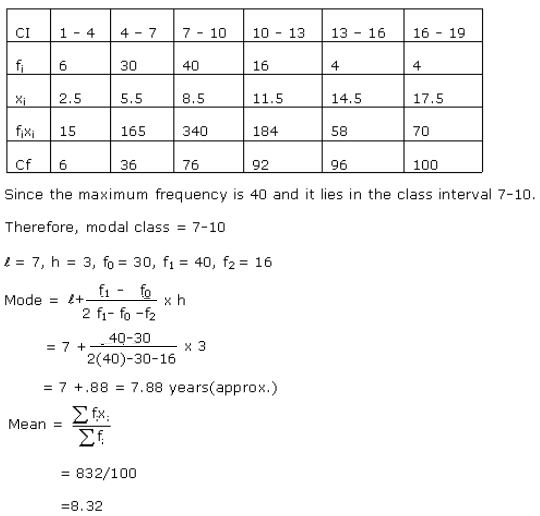
Q9. The marks obtained in a class test by 30 students of a class are as follows.
Marks obtained
Number of students
More than or equal to 5
30
More than or equal to 10
28
More than or equal to 15
16
More than or equal to 20
14
More than or equal to 25
10
More than or equal to 30
7
More than or equal to 35
3
Draw a less than type and more than type ogive curves for the given data and hence find the median.
Solution
From the given data, we can get the following table.
C I
f
cf
5 - 10
2
2
10 - 15
12
14
15 - 20
2
16
20 - 25
4
20
25 - 30
3
23
30 -35
4
27
35 - 40
3
30
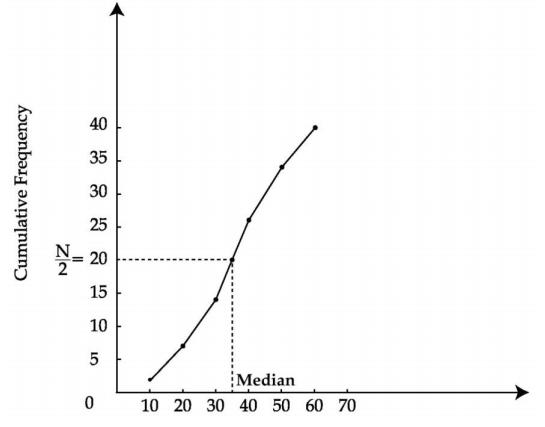
We plot points (5, 30) (10, 28) (15, 16) (20, 14) (25, 10) (30, 7) (35, 3) to get "more than" curve.
We plot points (10, 2) (15, 14) (20, 16) (25, 20) (30, 23) (35, 27) (40, 30) to get "less than" curve.
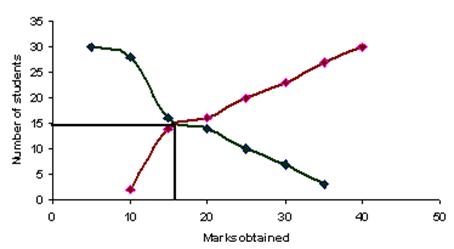 Median=17. 5 (x-coordinate of intersection of both curves)
Median=17. 5 (x-coordinate of intersection of both curves)
Q10. Find the missing frequency f if the mode of the given data is 154.
Class
120 - 130
130 - 140
140 - 150
150 - 160
160 - 170
170 - 180
Frequency
2
8
12
f
8
7
Solution
Class
120 - 130
130 - 140
140 - 150
150 - 160
160 - 170
170 - 180
Frequency
2
8
12
f
8
7
Mode = 154
Modal class = 150 - 160
So, l = 150, f1 = f, f0 = 12, f2 = 8, h = 10
We know,
Mode = l + 
 154 = 150 +

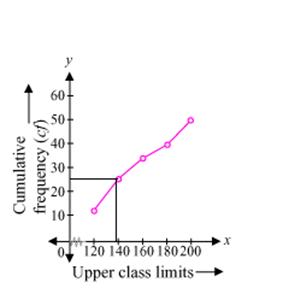
Q11. Change the following frequency distribution to less than type distribution and draw its ogive. Hence, obtain the median value.
Classes
10 - 20
20 - 30
30 - 40
40 - 50
50 - 60
60 - 70
70 - 80
Frequency (f)
5
15
18
25
11
9
8
Solution
Classes
Frequency
Less than 20
5
Less than 30
20
Less than 40
38
Less than 50
63
Less than 60
74
Less than 70
83
Less than 80
91
Plot the points (20,5), (30,20), (40,38), (50,63), (60,74), (70,83), (80,91) and join them by free hand to obtain the required ogive.
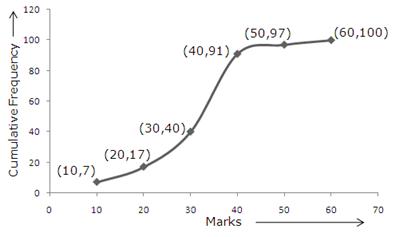
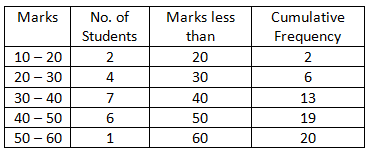
Q12. For the data given below draw less than ogive curve.
Marks
0 - 10
10 - 20
20 - 30
30 - 40
40 - 50
50 - 60
Number of students
7
10
23
51
6
3
Solution
We first prepare the cumulative frequency distribution table as given below:
Marks
No. of students
Marks less than
Cumulative frequency
0-10
7
10
7
10-20
10
20
17
20-30
23
30
40
30-40
51
40
91
40-50
6
50
97
50-60
3
60
100
Now, we mark the upper class limits along x-axis bt taking a suitable scale and the cumulative frequencies along y-axis by taking a suitable scale.
Thus, we plot the points (10,7),(20,17),(30,40),(40,91),(50,97)and(60,100).
Join the plotted points by a free hand to obtain the required ogive.
Q13. For the following distribution the difference in the upper limit of median and modal class is
CI
0-10
10-20
20-30
30-40
40-50
f
2
5
7
5
2
Solution
CI
0-10
10-20
20-30
30-40
40-50
f
2
5
7
5
2
cf
2
7
14
19
21
Highest frequency 7 is corresponding to the class 20-30 so it is the modal class.
Upper limit of modal class = 30.
 =10.5
Class interval with cf just greater than 10.5 is 20-30.
So the median class is 20-30.
Upper limit of median class = 30
Difference between the upper limit of the modal and median class is 30-30=0.
=10.5
Class interval with cf just greater than 10.5 is 20-30.
So the median class is 20-30.
Upper limit of median class = 30
Difference between the upper limit of the modal and median class is 30-30=0.
Q14. The
mean of the following frequency distribution is 8.4. Find the value of p.
Classes
0
- 4
4
- 8
8
- 12
12
- 16
16
- 20
Frequency
(f)
7
10
p
8
2
Solution
Classes
0
- 4
4
- 8
8
- 12
12
- 16
16
- 20
Frequency
(f)
7
10
p
8
2
x
2
6
10
14
18
fx
14
60
10p
112
36
 Mean
=
Mean
= 

Q15. The following table gives the age of doctors working in a hospital.
Age in years
25-30
30-35
35-40
40-45
45-50
No. of doctors
4
5
8
6
7
Change the above distribution to more than type and draw its ogive. Hence, find the median of the data.
Solution
Cumulative distribution of more than type is as follows:
Age in years
No. of doctors
Age more than or equal to
Cumulative Frequency
25 - 30
4
25
30
30 - 35
5
30
26
35 - 40
8
35
21
40 - 45
6
40
13
45 - 50
7
45
7
Total
30
Now, mark the lower class limits on x-axis and cumulative frequencies along Y-axis on suitable scales.
Thus, we plot the points (25, 30) (30, 26) (35, 21) (40, 13) and (45, 7).
By joining these points, we obtain the ogive as shown below:
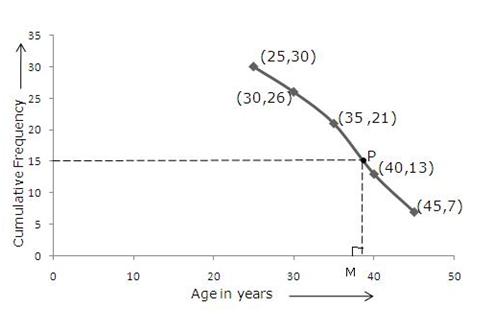 Here, N = 30
  Now, draw a line parallel to x-axis, from the point marked with frequency = 15, cutting the more than ogive at point P. Then, draw perpendicular PM from P on the x-axis. The x-coordinate of point M gives the median. Thus, M = 38.8 (approx).
Here, N = 30
Q16. Find the mode of the following data
Class
50 - 60
60- 70
70 - 80
80 - 90
90 - 100
Frequency
9
12
20
11
10
Solution
Modal class = 70 - 80
l = 70, fo = 12, f1 = 20, f2 = 11, h = 10

 =
=  = 70 + 4.7
= 74.7
= 70 + 4.7
= 74.7
Q17. 
Solution
Q18. If the mode of some data is 7 and their mean is also 7, then their median is:
Solution
We know:
Mode = 3 Median - 2 Mean
3 Median = Mode + 2 Mean
3 Median = 7 + 2 x 7 = 7 + 14 = 21
Thus, Median = 7
Q19. The following expenditure gives state wise teacher student ratio in higher secondary schools in India. Find the mode of this data.
Number of students per teacher
Number of states
15-20
3
20-25
8
25-30
9
30-35
10
35-40
3
40-45
0
45-50
0
50-55
2
Solution
Number of students per teacher
Number of states
15-20
3
20-25
8
25-30
9
30-35
10 modal class
35-40
3
40-45
0
45-50
0
50-55
2

Q20. The lower limit of the modal class of the following data is:
C.I.
0 - 10
10 - 20
20 - 30
30 - 40
40 - 50
Frequency
5
8
13
7
6
Solution
Modal class is 20 - 30.
Thus, the required lower limit of the modal class is 20.
Q21. The distribution below given the weight of 30 students of a class. Find the median weight of the students.
Weight in kg
40 - 45
45 - 50
50 - 55
55 - 60
60 - 65
65 - 70
70 - 75
No. of students
2
3
8
6
6
3
2
Solution
Weight (in kg)
No. of students
c.f.
40 - 45
2
2
45 - 50
3
5
50 - 55
8
13
55 - 60
6
19
60 - 65
6
25
65 - 70
3
28
70 - 75
2
30
Here, n = 30
 The cumulative frequency just greater than n/2=15 is 19 and the corresponding class is 55 - 60.
Hence, 55 - 60 is the median class.
Thus, we have
l = 55, c.f. = 13, f = 6, h = 5
Median = l +
The cumulative frequency just greater than n/2=15 is 19 and the corresponding class is 55 - 60.
Hence, 55 - 60 is the median class.
Thus, we have
l = 55, c.f. = 13, f = 6, h = 5
Median = l + 
 = 55 + 1.67
= 56.67
= 55 + 1.67
= 56.67
Q22. 
Solution
Mean of 10 numbers = 12
Thus, sum of 10 numbers = 12 x 10 = 120
Mean of 20 numbers = 9
Thus, sum of 20 numbers = 20 x 9 = 180
Now, Mean of 30 numbers = 

Q23. 
Solution
Q24. The following table shows the heights of 50 boys:
Height (cm)
120
121
122
123
124
Frequency
5
8
18
10
9
Find the mode of heights.
Solution
We observe that the height 122 cm has the highest frequency of 18.
Hence, the modal value of height is 122 cm.
Q25. Find
the median of the following data
Class
0
- 10
10
- 20
20
- 30
30
- 40
40
- 50
Total
Frequency
8
16
36
34
6
100
Solution
Class
0
- 10
10
- 20
20
- 30
30
- 40
40
- 50
Frequency
(f)
8
16
36
34
6
c.f
8
24
60
94
100
Here,
n = 100  Median
class = 20 - 30
l = 20, f = 36, c.f. = 24 and h = 10
Median
class = 20 - 30
l = 20, f = 36, c.f. = 24 and h = 10

Q26. The mean of 6 numbers is 16. With the removal of a number the mean of remaining numbers is 17. The number removed is:
Solution
We know:
Mean =  Mean of 6 numbers = 16
Sum of the 6 observations =
Mean of 6 numbers = 16
Sum of the 6 observations =  Mean of 5 observations = 17
Sum of the 5 observations =
Mean of 5 observations = 17
Sum of the 5 observations =  Thus, number which is removed = 96 - 85 = 11
Mean of 5 observations = 17
Sum of the 5 observations =
Thus, number which is removed = 96 - 85 = 11
Q27. 
Solution
Q28. Find the mean of the following frequency
distribution.
C.I.
0-100
100-200
200-300
300-400
400-500
f
2
3
5
2
3
Solution
To calculate the mean, first obtain the column
of mid value and then multiply the corresponding values of frequency and mid
value.
C.I.
f
Mid
value
(x)
fx
0-100
2
50
100
100-200
3
150
450
200-300
5
250
1250
300-400
2
350
700
400-500
3
450
1350
15
3850
Here  and
and  , so the mean is given as

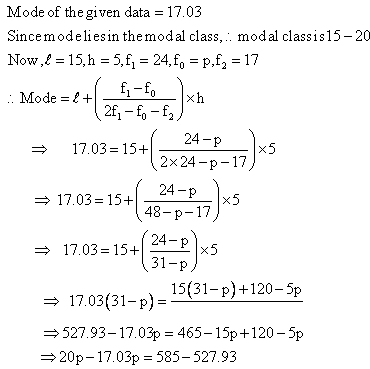
Q29. The mode of the following distribution is 17.03.Find the value of p.
Class interval
Frequency
0-5
6
5-10
11
10-15
p
15-20
24
20-25
17
25-30
13
30-35
5
Solution


Q30. Find the mean of the following data.
x
0
12
14
16
18
f
2
3
1
6
3
Solution
xi
fi
fi xi
0
2
0
12
3
36
14
1
14
16
6
96
18
3
54
 200
200

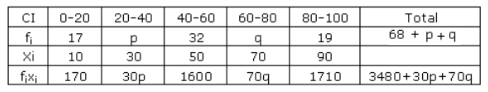
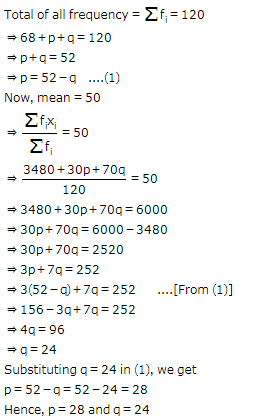
Q31. The
mean of the following frequency distribution is 50. Find the value of p.
Classes
0 -
20
20 -
40
40 -
60
60 -
80
80 -
100
Frequency
17
28
32
p
19
Solution
Classes
xi
fi
xifi
0
- 20
10
17
170
20
- 40
30
28
840
40
- 60
50
32
1600
60
- 80
70
p
70p
80
- 100
90
19
1710
Total
96
+ p
4320
+ 70p

Q32. If the median class is 30-40, the frequency of the median class is 20, the cumulative frequency of the preceding class is 15 and the total frequency is 50, then find the median.
Solution
According to the question,
l = 30, h = 10, f = 20, cf= 15, n = 50, n/2 = 25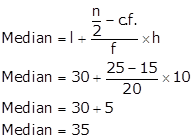
Q33. An incomplete distribution is given as follows:
Variable
0-10
10-20
20-30
30-40
40-50
50-60
60-70
Frequency
10
20
?
40
?
25
15
The median value is 35 and the sum of all the frequencies is 170. Using the median formula, fill up the missing frequencies.
Solution
Let the frequency of class 20 – 30 be f1 and that of class 40 – 50 be f2.
The total frequency is 170.
Class interval
f
cf
0 -10
10
10
10 – 20
20
30
20 – 30
f1
30 + f1
30 – 40
40
70 + f1
40 -50
f2
70 + f1+ f2
50 - 60
25
95 + f1+ f2
60 -70
15
110 + f1+ f2

Q34. 200 surnames were randomly picked up from a local telephone directory and the frequency distribution of the number of letters in English alphabets in the surnames was obtained as follows:
No. of letters
1 - 5
5 - 10
10 - 15
15 - 20
20 - 25
No. of surnames
20
60
80
32
8
Find the median.
Solution
C.I
1 - 5
5 - 10
10 - 15
15 - 20
25 - 25
f
20
60
80
32
8
c.f.
20
80
160
192
200
 Median class = 10 - 15
l = 10, f = 80, c.f. = 80 and h = 5
Median class = 10 - 15
l = 10, f = 80, c.f. = 80 and h = 5
 Thus, Median = 10 + 1.25 = 11.25
Thus, Median = 10 + 1.25 = 11.25
Q35. Find the mode from the following data:
2-4
4-6
6-8
8-10
10-12
12-14
5
8
10
6
7
2
Solution
2-4
4-6
6-8
8-10
10-12
12-14
5
8 = f0
9 = f1
6 = f2
7
2
8 = f0, 9 = f1, 6 = f2, h = 2, l = 6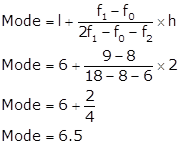
Q36. Find
the mean of the following frequency distribution, using step deviation
method.
Classes
100
- 150
150
- 200
200
- 250
250
- 300
300
- 350
Frequency
4
5
12
2
2
Solution
C.I.
f
x
d
= x - 225
d'
=  fd'
100
- 150
4
125
-100
-2
-8
150
- 200
5
175
-50
-1
-5
200
- 250
12
225
0
0
0
250
- 300
2
275
50
1
2
300
- 350
2
325
100
2
4
25
-7
Here,
A = 225
fd'
100
- 150
4
125
-100
-2
-8
150
- 200
5
175
-50
-1
-5
200
- 250
12
225
0
0
0
250
- 300
2
275
50
1
2
300
- 350
2
325
100
2
4
25
-7
Here,
A = 225

Q37. Find the values of a, b, c and d in the following frequency distribution:
Class interval
Frequency
Cumulative Frequency
0 – 20
5
a
20 – 40
10
15
40 - 60
b
23
60 - 80
c
30
80 - 100
4
d
Solution

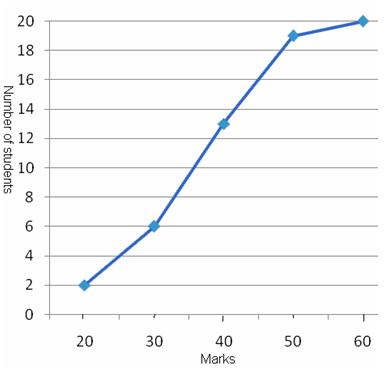
Q38. Draw a 'less than ogive' for the given data.
Marks
10-20
20-30
30-40
40-50
50-60
No. of students
2
4
7
6
1
Solution
Q39. The mean ( ) of a frequency distribution is 45. If the value of
  = 20 then the value of
  is:
is:
- 1) 900
- 2) 800
- 3) 2.25
-
4)

Solution
We know:

Q40. Change the following frequency distribution to more than type distribution and draw its ogive. Hence, find its median.
Classes
0 - 5
5 - 10
10 - 15
15 - 20
20 - 25
Frequency (f)
6
8
10
6
4
Solution
Lower class limits
c.f.
More than 0
34
More than 5
28
More than 10
20
More than 15
10
More than 20
4
Plot the points (0, 34), (5, 28), (10, 20), (15, 10), (20, 4) to obtain the required ogive.
The median will be corresponding x-coordinate of the point whose ordinate is  .
.
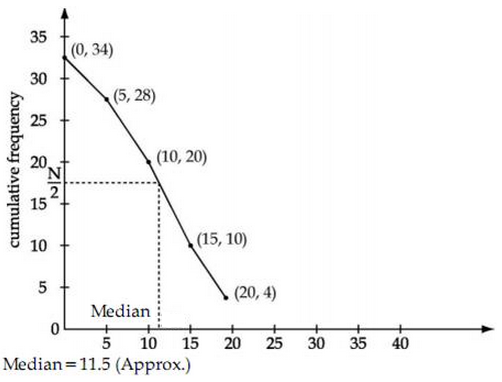
.
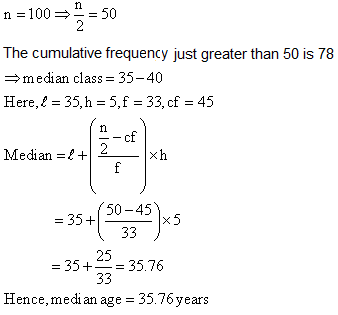
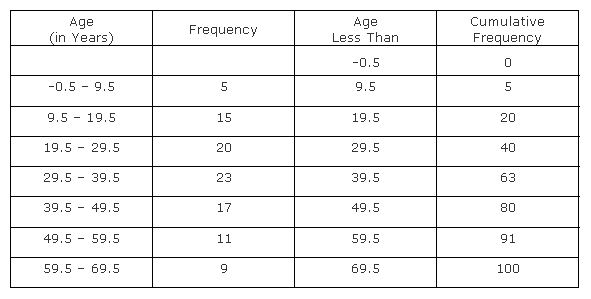
Q41. A life insurance agent found the following data for distribution of ages of 100 policy holders. Calculate the median age, if the policies are given only to persons having age between 18 and 60 years.
Age in years
Number of policy holders
Below 20
2
Below 25
6
Below 30
24
Below 35
45
Below 40
78
Below 45
89
Below 50
92
Below 55
98
Below 60
100
Solution
Class interval
f
cf
15-20
2
2
20-25
4
6
25-30
18
24
30-35
21
45
35-40
33
78
40-45
11
89
45-50
3
92
50-55
6
98
55-60
2
100
Q42. 
Solution
Q43. A survey regarding the heights (in cm) of 50 girls of class X of a school was conducted and the following data was obtained:
Height (in cm)
120 - 130
130 - 140
140 - 150
150 – 160
160 – 170
Total
Number of girls
2
8
12
20
8
50
Find the mean, median and mode of the above data.
Solution
Height in cm
Number of girls
Cumulative Frequency
120 – 130
2
2
130 – 140
8
10
140 – 150
12
22
150 – 160
20
42
160 – 170
8
50
Total
50
Q44. In the distribution given below 50% of the observations is more than 14.4. Find the values of x and y, if the total frequency is 20.
Class Interval
0-6
6-12
12-18
18-24
24-30
Frequency
4
x
5
y
1
Solution
Class Interval
0-6
6-12
12-18
18-24
24-30
Frequency
4
x
5
y
1
Cumulative frequency
4
4+x
9+x
9+x+y
10+x+y
It is given that total frequency N is 20
So, 10+x+y = 20 i.e. x + y = 10
Given 50% of the observations are greater than 14.4 so median = 14.4, which lies in the class interval 12-18.
 = 12, cf = 4 + x, h = 6, f = 5, N = 20
Median =
= 12, cf = 4 + x, h = 6, f = 5, N = 20
Median = 14.4 = 12 +
  x 6
14.4 - 12 =
x 6
14.4 - 12 =  x6
x6
 = 6 - x
Þx =4
Now using equation, 10 + x + y = 20, we get y = 6.
Hence x = 4 and y = 6.
= 6 - x
Þx =4
Now using equation, 10 + x + y = 20, we get y = 6.
Hence x = 4 and y = 6.
14.4 = 12 +
Q45. Write the following distribution as 'less than' type cumulative frequency distribution:
C.I
0 - 10
10 - 20
20 - 30
30 - 40
40 - 50
50 - 60
60 - 70
70 - 80
Frequency
5
3
4
3
3
4
7
9
Solution
Less than type cumulative frequency distribution is as follows:

Q46. 
Solution
Q47. Compute the median for the following data:
Marks (more than or equal to)
Number of students
80
150
90
141
100
124
110
105
120
60
130
27
140
12
150
0
Solution
First prepare the cumulative frequency table:
Marks
No. of students
Cumulative frequency
80 - 90
150 – 141 = 9
9
90 – 100
141 – 124 = 17
9 +17 = 26
100 - 110
124 – 105 = 19
26 +19 = 45
110 - 120
105 – 60 = 45
45 + 45 = 90
120 -130
60 – 27 = 33
90 + 33 = 123
130 – 140
27 – 12 = 15
123 + 15 = 138
140 -150
12- 0 = 12
138 + 12 =150
Q48. Compute the median for the following data:
Class interval
Less than
20
Less than 30
Less than 40
Less than 50
Less than 60
Less than 70
Less than 80
Less than 90
Less than 100
Cumulative Frequency
0
4
16
30
46
66
82
92
100
Solution
C.I.
f
c.f.
20 - 30
4
4
30 - 40
12
16
40 - 50
14
30
50 - 60
16
46
60 - 70
20
66
70 - 80
16
82
80 - 90
10
92
90 - 100
8
100
100
Here, N = 100
 The cumulative frequency just greater than N/2=50 is 66 and the corresponding class is 60 - 70
Hence, 60 - 70 is the median class.
Thus, we have
l = 60, c.f. = 46, f = 20, h = 10
Median =
The cumulative frequency just greater than N/2=50 is 66 and the corresponding class is 60 - 70
Hence, 60 - 70 is the median class.
Thus, we have
l = 60, c.f. = 46, f = 20, h = 10
Median =  =
=  = 60 + 2 = 62
=
Q49. The
mean of the following frequency distribution is 25. Determine the value of p
Classes
0
- 10
10
- 20
20
- 30
30
- 40
40
- 50
Frequency
5
18
15
P
6
Solution
Classes
Frequency (f)
Mid-value (x)
fx
0 - 10
5
5
25
10 - 20
18
15
270
20 - 30
15
25
375
30 - 40
P
35
35p
40 - 50
6
45
270
44 + p
940 + 35p
Mean
= 
 940
+ 35 p = 1100 + 25p
10p
= 160
940
+ 35 p = 1100 + 25p
10p
= 160
 p = 16
Q50. Find the median wages for the following frequency distribution:
Wages per day (in Rs.)
Number of workers
61 – 70
5
71 – 80
15
81 – 90
20
91 – 100
30
101 – 110
20
111 - 120
8
Solution
Here the classes are in discontinuous form. So, convert the classes into continuous form.
Adjustment factor = 1/2 (lower limit of one class – upper limit of previous class
= 1/2(71 – 70) =.5
To convert discontinuous classes, subtract the adjustment factor from each lower limit and add the adjustment factor to each upper limit.
Wages per day
f
cf
60.5 – 70.5
5
5
70.5 - 80.5
15
20
80.5 – 90.5
20
40
90.5 – 100.5
30
70
100.5 – 110.5
20
90
110.5 – 120.5
8
98

Q51. Find the mean of the following data.
x
0-2
2-4
4-6
6-8
8-10
10-12
12-14
f
1
2
1
5
6
2
3
Solution
Class Intervals
fi
xi
fi xi
0-2
1
1
1
2-4
2
3
6
4-6
1
5
5
6-8
5
7
35
8-10
6
9
54
10-12
2
11
22
12-14
3
13
39
20
162

Q52. The distribution given below shows the weights of 30 students of a class. Find the median weight of the students
Weight (in kg)
40-45
45-50
50-55
55-60
60-65
65-70
70-75
No. of students
2
3
8
6
6
3
2
Solution
Class interval
f
cf
40-45
2
2
45-50
3
5
50-55
8
13
55-60
6
19
60-65
6
25
65-70
3
28
70-75
2
30

Q53. The arithmetic mean of the following data is 25. Find the value of p.
Classes:
0 - 10
10 - 20
20 - 30
30 - 40
40 - 50
Frequency, f:
3
P
3
6
2
Solution
Classes:
0 - 10
10 - 20
20 - 30
30 - 40
40 - 50
Frequency, f:
3
p
3
6
2
x:
5
15
25
35
45
fx:
15
15p
75
210
90

Q54. Construct the cumulative frequency distribution of the following distribution and find the median class.
Class
12.5 - 17.5
17.5 - 22.5
22.5 - 27.5
27.5 - 32.5
32.5 - 37.5
Frequency
2
22
19
14
13
Solution
C.I.
f
c.f.
12.5 - 17.5
2
2
17.5 - 22.5
22
24
22.5 - 27.5
19
43
27.5 - 32.5
14
57
32.5 - 37.5
13
70
Here, N = 70

 The cumulative frequency just greater than N/2=35 is 43 and the corresponding class is 22.5 - 27.5.
 Median Class is 22.5 - 27.5
Q55. The average height of 30 boys is 150 cm. It was detected later that one value of 165 cm was wrongly copied as 135 cm for the computation of the mean. Find the correct mean.
Solution

Q56. The mean and median of same data are 24 and 26 respectively. The value of mode is :
Solution
We know:
Mode = 3 Median - 2 Mean
= 3 x 26 - 2 x 24
= 78 - 48
= 30
Q57. The mean of 5 observations x, x + 2, x + 4, x + 6 and x + 8 is 11, then the value of x is:
Solution
Mean = 

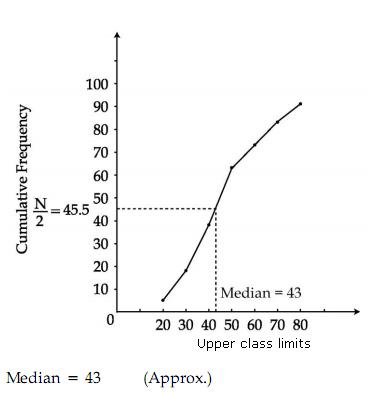
Q58. Change
the following frequency distribution to less than type distribution and draw
it's ogive. Hence, obtain the median value.
Classes
0
- 10
10
- 20
20
- 30
30
- 40
40
- 50
50
- 60
Frequency
f
2
5
7
12
8
6
Solution
Upper
class limits
c.f.
Less
than 10
2
Less
than 20
7
Less
than 30
14
Less
than 40
26
Less
than 50
34
Less
than 60
40
Plot
the points (10, 2), (20, 7), (30, 14), (40, 26), (50, 34), (60, 40) to obtain
the required ogive.
 Here,
N = 40
N/2
= 20
So,
mark the point whose ordinate is 20, its x-coordinate is 32.
Here,
N = 40
N/2
= 20
So,
mark the point whose ordinate is 20, its x-coordinate is 32.
 Median
= 32 (Approx.)
Median
= 32 (Approx.)
Here,
N = 40
N/2
= 20
So,
mark the point whose ordinate is 20, its x-coordinate is 32.
Q59. The mean of 25 observations is 36. If the mean of first 13 observations is 32 and that of the last 13 observations is 39, find the 13th observation.
Solution

Q60. For
the following data, find mode.
Class
1 -
3
3 -
5
5 -
7
7 -
9
9 -
11
Frequency
14
16
4
4
2
Solution
Modal
class = 3 - 5
l = 3, f1 = 16, f0 = 14,
f2 = 4, h = 2
 Mode
= 3 +
Mode
= 3 +  Mode
= 3.3 (approximately)
Mode
= 3.3 (approximately)
Mode
= 3 +
Q61. Find the median of the following data:
Marks
0 - 10
10 - 30
30 - 60
60 - 80
80 - 100
Frequency
5
15
30
8
2
Solution
Marks
f
cf
0 - 10
5
5
10 - 30
15
20
30 - 60
30
50
60 - 80
8
58
80 - 100
2
60
N= Here, N = 60
So, N/2 = 30
The cumulative frequency is just greater than N/2 = 30 is 50 and the corresponding class is 30-60.
Hence, 30-60 is the median class.
Therefore, l = 30, f = 30, cf = 20, h = 30
Thus, Median is given by
Here, N = 60
So, N/2 = 30
The cumulative frequency is just greater than N/2 = 30 is 50 and the corresponding class is 30-60.
Hence, 30-60 is the median class.
Therefore, l = 30, f = 30, cf = 20, h = 30
Thus, Median is given by
 Thus, Median = 40
Thus, Median = 40
Q62. Change
the given distribution to more than type distribution and draw its ogive.
Classes
20
- 25
25
- 30
30
- 35
35
- 40
40
- 45
45
- 50
Frequency
3
6
12
9
6
4
Solution
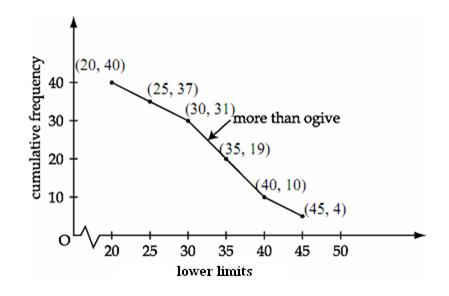
More
than type distribution:
Classes
Frequency
More
than 20
40
More
than 25
37
More
than 30
31
More
than 35
19
More
than 40
10
More
than 45
4
Q63. Find the median of the following data:
Classes
500 - 600
600 - 700
700 - 800
800 - 900
900 - 1000
Frequency
40
28
35
22
25
Solution
Classes
f
cf
500 - 600
40
40
600 - 700
28
68
700 - 800
35
103
800 - 900
22
125
900 - 1000
25
150
Here, N = 150
 The cumulative frequency just greater than N/2=75 is 103 and the corresponding class is 700 - 800.
Hence, 700 - 800 is the median class.
Thus, we have
l = 700, c.f. = 68, f = 35, h = 100
Thus, Median =
The cumulative frequency just greater than N/2=75 is 103 and the corresponding class is 700 - 800.
Hence, 700 - 800 is the median class.
Thus, we have
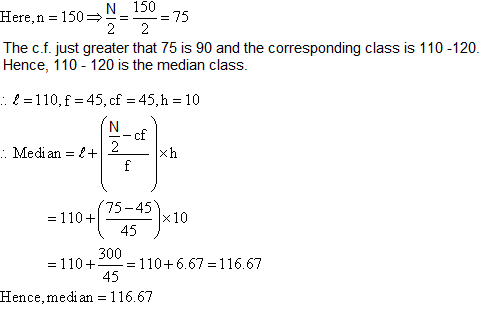
l = 700, c.f. = 68, f = 35, h = 100
Thus, Median = 

Q64. 
Solution
Q65. Convert the following data to a less than type distribution and draw its Ogive. Also find the median from the graph.
Class
100 - 120
120 - 140
140 - 160
160 - 180
180 -200
Frequency
12
14
8
6
10
Solution
Frequency distribution table of less than type is as follows:
Daily income
(in Rs)
(upper class limits)
Cumulative frequency
Less than 120
12
Less than 140
12 + 14 = 26
Less than 160
26 + 8 = 34
Less than 180
34 + 6 = 40
Less than 200
40 + 10 = 50
Now taking upper class limits of class intervals on x-axis and their respective frequencies on y-axis, we can draw its ogive as follows:
 Here, N = 50
N/2 = 25
Now, mark the point on curve whose y-coordinate is 25, its corresponding x-coordinate is 138.5. So median of this data is 138.5 (approximately).
Here, N = 50
N/2 = 25
Now, mark the point on curve whose y-coordinate is 25, its corresponding x-coordinate is 138.5. So median of this data is 138.5 (approximately).
Here, N = 50
N/2 = 25
Now, mark the point on curve whose y-coordinate is 25, its corresponding x-coordinate is 138.5. So median of this data is 138.5 (approximately).
Q66. 
Solution
Q67. Find the mean of the following data using step deviation method:
Classes
25 - 30
30 - 35
35 - 40
40 - 45
45 - 50
50 - 55
55 - 60
Frequency
14
22
16
6
5
3
4
Solution
Class
xi
fi
di = xi - a
 fi ui
25 - 30
27.5
14
-15
-3
-42
30 - 35
32.5
22
-10
-2
-44
35 - 40
37.5
16
-5
-1
-16
40 - 45
42.5 = a
6
0
0
0
45 - 50
47.5
5
5
1
5
50 - 55
52.5
3
10
2
6
55 - 60
57.5
4
15
3
12
fi ui
25 - 30
27.5
14
-15
-3
-42
30 - 35
32.5
22
-10
-2
-44
35 - 40
37.5
16
-5
-1
-16
40 - 45
42.5 = a
6
0
0
0
45 - 50
47.5
5
5
1
5
50 - 55
52.5
3
10
2
6
55 - 60
57.5
4
15
3
12

 = -79
a = 42.5, h = 5
= -79
a = 42.5, h = 5
 = 42.5 + 5
 = 42.5 - 5.64
= 36.86
= 42.5 - 5.64
= 36.86
= 42.5 + 5
Q68. Find
the mean of the following frequency distribution using assumed mean method:
Classes
2
- 8
8
- 14
14
- 20
20
- 26
26
- 32
Frequency
6
3
12
11
8
Solution
Classes
fi
xi
di
= xi - A
di
 fi
2
- 8
6
5
-12
-72
8
- 14
3
11
-6
-18
14
- 20
12
(17)
= A
0
0
20
- 26
11
23
6
66
26
- 32
8
29
12
96
Here,
A
= 17
fi
2
- 8
6
5
-12
-72
8
- 14
3
11
-6
-18
14
- 20
12
(17)
= A
0
0
20
- 26
11
23
6
66
26
- 32
8
29
12
96
Here,
A
= 17

 = 17 + 1.8 = 18.8
= 17 + 1.8 = 18.8
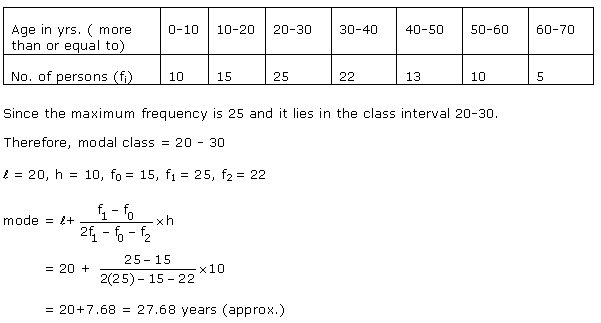
Q69. The ages of employees in a factory areas follows:
Age in years
17 - 23
23 - 29
29 - 35
35 - 41
41 - 47
47 - 53
No. of employees
2
5
6
4
2
1
Find the median age of the employees.
Solution
Age
17 - 23
23 - 29
29 - 35
35 - 41
41 - 47
47 - 53
No. of employees (f)
2
5
6
4
2
1
c.f.
2
7
13
17
19
20
Here, N = 20  The cumulative frequency just greater than N/2=10 is 13 and the corresponding class is 29-35.
Hence, Median class is 29-35.
Thus, we have
l = 29, c.f. = 7, f = 6, h = 6
Thus, Median is given by
Median =
The cumulative frequency just greater than N/2=10 is 13 and the corresponding class is 29-35.
Hence, Median class is 29-35.
Thus, we have
l = 29, c.f. = 7, f = 6, h = 6
Thus, Median is given by
Median = 
The cumulative frequency just greater than N/2=10 is 13 and the corresponding class is 29-35.
Hence, Median class is 29-35.
Thus, we have
l = 29, c.f. = 7, f = 6, h = 6
Thus, Median is given by
Median =
Q70. Find the median of the following data:
Class
0 - 10
10 - 20
20 - 30
30 - 40
40 - 50
Total
Frequency
8
16
36
34
6
100
Solution
Class
Frequency (f)
c.f.
0 - 10
8
8
10 - 20
16
24
20 - 30
36
60
30 - 40
34
94
40 - 50
6
100
Here, n = 100
 The cumulative frequency just greater than N/2=50 is 60 and the corresponding class is 20 - 30.
Hence, 20 - 30 is the median class.
Thus, we have
l = 20, c.f. = 24, f = 36, h = 10
The cumulative frequency just greater than N/2=50 is 60 and the corresponding class is 20 - 30.
Hence, 20 - 30 is the median class.
Thus, we have
l = 20, c.f. = 24, f = 36, h = 10
 Thus, Median = 27.2
Thus, Median = 27.2
Q71. Find unknown entries a, b, c, d, e, f in the following distribution of heights of
students in a class if the total number of students in the class in 50.
Height in cm
150 - 155
155 - 160
160 - 165
165 - 170
170 - 175
175 - 180
Frequency
12
b
10
d
e
2
Cumulative Frequency
a
25
c
43
48
f
Solution
a = 12
a + b = 25
 b = 13
c = 25 + 10 = 35
c + d = 43
d = 43 - 35 = 8
43 + e = 48
e = 5
f = 48 + 2 = 50
b = 13
c = 25 + 10 = 35
c + d = 43
d = 43 - 35 = 8
43 + e = 48
e = 5
f = 48 + 2 = 50
Q72. Find
the mode of the following distribution of marks obtained by 50 students.
Marks
0
- 10
10
- 20
20
- 30
30
- 40
40
- 50
No.
of students
4
8
10
20
8
Solution
Marks
0
- 10
10
- 20
20
- 30
30
- 40
40
- 50
No.
of students
4
8
10
20
8
f0
f1
f2
Maximum
frequency = 20 (f1)
Modal
class = 30 - 40
 = 34.55
= 34.55
Q73. 
Solution

Q74. Write any two merits and demerits of arithmetic mean.
Solution
Merits: (1) It is based on all observations
(2)It is simple to understand and calculate
Demerits: (1) It is affected by extreme values
(2) It cannot be determined graphically.
Q75. Find the median of the following data:
Class
0 - 10
10 - 20
20 - 30
30 - 40
40 - 50
Total
Frequency
8
16
36
34
6
100
Solution
Class
0 - 10
10 - 20
20 - 30
30 - 40
40 - 50
Frequency
8
16
36
34
6
c.f.
8
24
60
94
100
n = 100  = 50
Thus, Median class = 20 - 30,
We have, l = 20, h = 10, c.f. = 24, f = 36
Median=l +
= 50
Thus, Median class = 20 - 30,
We have, l = 20, h = 10, c.f. = 24, f = 36
Median=l + 
 = 20 + 7.2
= 27.2
= 20 + 7.2
= 27.2
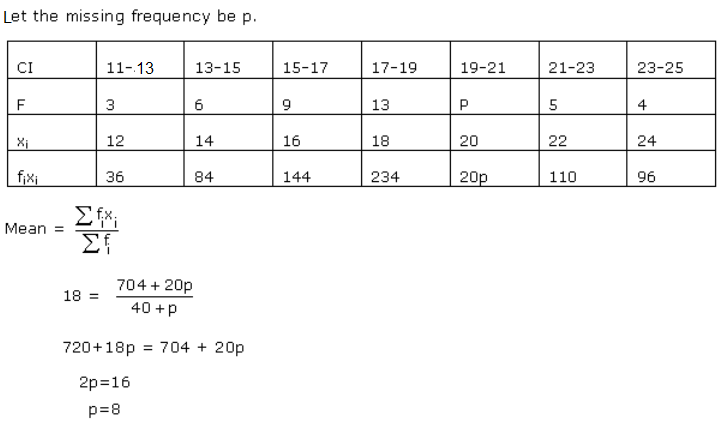
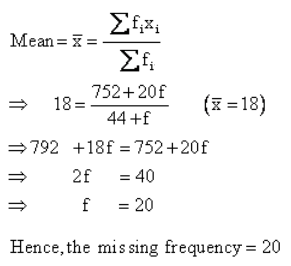
Q76. The following distribution shows the daily pocket money of children of a locality. The mean pocket allowance is Rs. 18. Find the missing frequency f.
Daily pocket money (in Rs.)
No. of children
11-13
7
13-15
6
15-17
9
17-19
13
19-21
f
21-23
5
23-25
4
Solution
Daily pocket money (in Rs.)
xi
fi
fi xi
11-13
12
7
84
13-15
14
6
84
15-17
16
9
144
17-19
18
13
234
19-21
20
f
20f
21-23
22
5
110
23-25
24
4
96
44+f


Q77. The following distribution gives the daily wages of workers of a factory.
Daily wages (in Rs)
20 - 40
40 - 60
60 - 80
80 - 100
100- 120
120 - 140
140 - 160
Number of workers
4
6
10
16
12
7
3
Convert the above distribution into a less than type cumulative frequency distribution. Draw its ogive and find the median.
Solution
We find the cumulative frequency distribution of daily wages of 50 workers of a factory as follows:
Daily wages (in Rs)
No. of Workers
Wages less than
Cumulative Frequency
20 - 40
40 - 60
60 - 80
80 - 100
100 - 120
120 - 140
140 - 160
4
6
10
16
12
7
3
40
60
80
100
120
140
160
4
10
20
36
48
55
58
Now we mark the upper class limits along x-axis on a suitable scale and the cumulative frequencies along y-axis on a suitable scale. Plot the points (40, 4), (60, 10), (80, 20), (100, 36), (120, 48), (140, 55) and (160, 58). Now, join the plotted points by line segments as shown.
 N = 58
The median is corresponding to the frequency
N = 58
The median is corresponding to the frequency  29
In order to find the median, we first locate the point corresponding to 29 on the y-axis let the point be P. From this point, draw a line parallel to the x-axis cutting the curve at Q. From this point Q draw a line parallel to y-axis and meeting x-axis at point M. The x-coordinate of M is the median. Thus, median = 91 (approx).
29
In order to find the median, we first locate the point corresponding to 29 on the y-axis let the point be P. From this point, draw a line parallel to the x-axis cutting the curve at Q. From this point Q draw a line parallel to y-axis and meeting x-axis at point M. The x-coordinate of M is the median. Thus, median = 91 (approx).
N = 58
The median is corresponding to the frequency
Q78. The following distribution shows the heights of students of a certain school. Find the modal height.
Height (in cm)
No. of students
160-162
15
163-165
118
166-168
142
169-171
127
172-174
18
Solution
Here the classes are in discontinuous form. So, first convert the classes into continuous form.
 Now, subtract the adjustment factor from each lower limit and add to each upper limit.
Height (in cm)
No. of students
159.5-162.5
15
162.5-165.5
118
165.5-168.5
142
168.5-171.5
127
171.5-174.5
18
Now, subtract the adjustment factor from each lower limit and add to each upper limit.
Height (in cm)
No. of students
159.5-162.5
15
162.5-165.5
118
165.5-168.5
142
168.5-171.5
127
171.5-174.5
18

Now, subtract the adjustment factor from each lower limit and add to each upper limit.
Height (in cm)
No. of students
159.5-162.5
15
162.5-165.5
118
165.5-168.5
142
168.5-171.5
127
171.5-174.5
18
Q79. Find
the mean age of the following data.
Age
(yrs)
10
- 30
30
- 50
50
- 70
70
- 90
No.
of persons
15
12
18
5
Solution
xi
(Mid-value)
20
40
60
80
fi
15
12
18
5
xi
fi
300
480
1080
400

Q80. Arithmetic mean of a set of 40 values is 65. If each of the 40 values is increased by 5, what will be the mean of the set of new values?
Solution

Q81. Find the mode of the given data:
Class
3 - 6
6 - 9
9 - 12
12 - 15
15 - 18
18 - 21
21 - 24
Frequency
2
5
10
23
21
12
3
Solution
Modal class = 12 - 15
l = 12, f1 = 23, fo = 10, f2 = 21, h = 3


Q82. Construct a cumulative frequency distribution table of the following distribution:
C.I.
12.5-17.5
17.5-22.5
22.5-27.5
27.5-32.5
32.5-37.5
F
2
22
19
14
13
C.I.
12.5-17.5
17.5-22.5
22.5-27.5
27.5-32.5
32.5-37.5
F
2
22
19
14
13
Solution
C.I.
F
C.F.
12.5-17.5
2
2
17.5-22.5
22
24
22.5-27.5
19
43
27.5-32.5
14
57
32.5-37.5
13
70
Q83. The following in the daily pocket money spent by students.
Pocket money ( )
0 - 15
15 - 30
30 - 45
45 - 60
60 - 75
No. of students
8
15
7
4
6
Find the mode of the above data.
)
0 - 15
15 - 30
30 - 45
45 - 60
60 - 75
No. of students
8
15
7
4
6
Find the mode of the above data.
Solution
Modal class is 15 - 30
Thus, we have
l = 15, f1 = 15, f0 = 8, f1 = 7, h = 15
Now, mode is given by

Q84. Find the mode of given distribution:
Class Interval
0 - 10
10 - 20
20 - 30
30 - 40
40 - 50
Frequency
2
12
22
8
6
Solution
Modal class = 20 - 30
Here, l = 20, f0 = 12, f1 = 22, f2 = 8, h = 10
Mode = l + Mode = 20 +
Q85. The mean weight of 150 students in a class is 60 kg. The mean weight of boys is 70 kg and that of girls is 55 kg. Find the number of boys and girls.
Solution

Q86. If
the mean of the following frequency distribution is 54, find the value of p.
Classes
0
- 20
20
- 40
40
- 60
60
- 80
80
- 100
Frequency
(f)
7
p
10
9
13
Solution
Classes
fi
xi
fixi
0
- 20
7
10
70
20
- 40
P
30
30p
40
- 60
10
50
500
60
- 80
9
70
630
80
- 100
13
90
1170
 = 39 + p
  = 2370 + 30p
Mean
=
= 2370 + 30p
Mean
= 

Q87. Find the mode of the following data.
x
10
12
14
16
18
20
f
5
3
10
3
2
1
Solution
We observe that the value 14 has the maximum frequency i.e. 10.
Hence, the modal value is 14.
Q88. 
Solution
Q89. In the following distribution:
Monthly income range (In Rs.)
No. of families
Income more than Rs 10000
100
Income more than Rs 13000
85
Income more than Rs 16000
69
Income more than Rs 19000
50
Income more than Rs 22000
33
Income more than Rs 25000
15
Find the number of families having income range (in Rs.) 16000-19000?
Solution
Monthly income range (In Rs.)
No. of families
10000-13000
15
13000-16000
16
16000-19000
19
19000-22000
17
22000-25000
18
25000-28000
15
No. of families having income range (in Rs.) 16000-19000 is 19.
Comments
Post a Comment